
Table of Contents

Reach SOC 2 Compliance in 6 Weeks or Less.

  /

  / Drata Agent Guide: Installation, Setup & Sync Troubleshooting

Drata Agent Guide: Installation, Setup & Sync Troubleshooting

The Drata Agent is the part of Drata’s compliance stack that actually touches employee devices. It is a lightweight, read-only desktop application that runs in the system toolbar, reads a narrow set of security configuration settings, and reports them back to the Drata platform on a daily schedule. If a SOC 2 or ISO 27001 audit depends on showing that every endpoint has disk encryption, screen lock, antivirus, a password manager, and automatic updates enabled, the Agent is the thing that produces that evidence.

This guide covers exactly what it does, how it works, how to install it on macOS, Windows, and Linux, and what to do when it stops syncing.
drata agent guide

What Is the Drata Agent?

The Drata Agent is a desktop application built with Electron, the same framework used by Slack, VS Code, and Discord. It uses osquery, an open-source endpoint instrumentation tool created at Facebook and now maintained as a Linux Foundation project, to query the operating system for specific configuration values. The Agent runs from the system toolbar — the menu bar on macOS, the system tray on Windows, and the indicator area on Linux — and synchronises once per day with Drata’s backend.

The full source code of the Agent has been open source since June 2023. Anyone can audit the code on Drata’s GitHub organisation, including security teams that need to validate it before deploying to the fleet.

The Agent supports the latest two major versions of each operating system. On macOS, that currently means macOS 26 (Tahoe) and macOS 15 (Sequoia), with Agent version 3.9.0 or higher. On Windows, it covers the two most recent stable versions Microsoft actively maintains. On Linux, only LTS distributions are supported; Ubuntu 22.04 LTS and 24.04 LTS are the current supported targets.


What the Drata Agent Does (and Does Not Do)

The Agent collects a tightly scoped list of configuration data points — specifically the items that map to typical SOC 2 and ISO 27001 device-level controls.

The Agent does read: disk encryption status (FileVault, BitLocker, LUKS); screen lock and screensaver configuration; installed antivirus or endpoint protection software; installed password manager applications; operating system version and update status; the list of installed applications and browser extensions for Chrome, Firefox, and Internet Explorer (used to detect AV and password manager presence); and the operating system identifier and machine serial number for asset attribution.

The Agent does not read keystrokes, browsing history, file contents, clipboard data, screen contents, network traffic, or any application data. Access is strictly read-only at the system-preferences level. The Agent cannot make changes to the device, push configuration, or remediate failed controls. If a check fails, the employee or IT team fixes it manually; the Agent simply observes whether the fix worked on the next sync.

Important: Read-only does not mean invisible. The Agent enumerates installed applications and browser extensions to detect antivirus and password manager presence, and this list is sent to Drata. If that level of visibility is a concern for privacy or works council requirements, address it before rollout — not after.

Reach SOC 2 Compliance in 6 Weeks or Less

Schedule Your Free SOC 2 Assessment Today

How Does the Drata Agent Work?

Once installed and registered, the Agent runs continuously in the background. It performs scheduled checks, reports results to Drata, and updates itself when new versions ship.

Synchronization Process

The Agent syncs once per day. The sync runs at the first opportunity each calendar day: typically, the first network connection after the device was off or asleep, the moment the user logs in if the Agent autostarts, or any manual trigger from the toolbar menu. The data sent is small — a structured report of the configuration values the Agent read, plus the Agent version and machine identifier. There is no telemetry of user activity.

When the sync succeeds, the device’s compliance status in Drata updates within a few minutes. When it fails, the device may show an Unable to get data status, and the corresponding controls in Drata will appear unconfirmed until the next successful sync.

Automatic Updates

The Agent updates itself. When a new version is released, the Agent shows a notification asking the user to allow the update. Updates are mandatory — running an outdated Agent eventually causes registration and sync failures. Linux installations through Ubuntu’s package manager auto-update via the system updater starting with version 3.6; AppImage installations and Arch AUR builds need to be updated manually or through the AUR helper.


Prerequisites Before Installing the Drata Agent

Before installation, three things need to be in place.

First, the device user needs an active Drata account with employee onboarding tasks assigned.

Second, the operating system must be a supported version.

Third, the user needs administrator rights on the device to install the application, since it registers a startup item.

The user will also need access to their work email during installation. Registration uses a magic-link verification flow, and the verification email arrives within a minute of clicking Register Drata Agent in the Drata UI.
Install Drata Agent - Mac

How to Install the Drata Agent on Mac

There are two practical paths on macOS: install through Homebrew Cask, or download the signed installer directly from MyDrata.

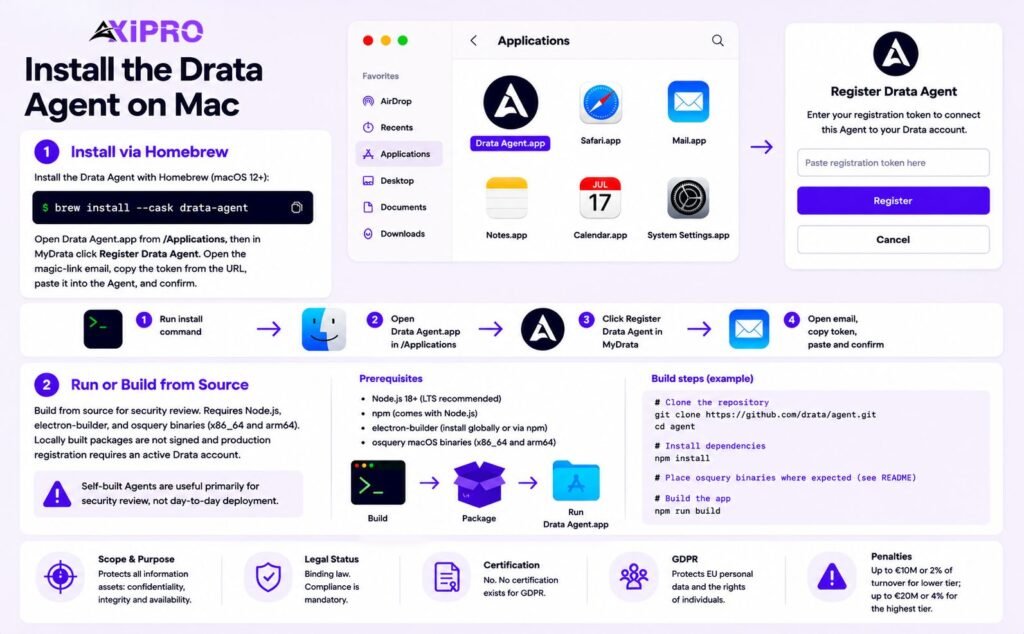
Installation via Homebrew

The Drata Agent is published as an official cask in the Homebrew repository, which is the cleanest install method for engineers who already use Homebrew for package management. The cask requires macOS 12 (Monterey) or newer. The install command is:

brew install –cask drata-agent

After Homebrew finishes, open Drata Agent.app from /Applications, then return to MyDrata and click Register Drata Agent. A magic-link email arrives shortly after. Open the link, copy the token portion of the URL, paste it into the Agent’s register dialog, and confirm.

Run or Build the Drata Agent on Mac

For organisations that want to build from source rather than use the published package, the GitHub repository contains the full Electron build pipeline. Build prerequisites include Node.js and electron-builder, and the osquery binaries need to be supplied separately. Drata explicitly notes that locally built packages are not signed and that production registration requires an active Drata account. Self-built Agents are useful primarily for security review, not day-to-day deployment.
How to Install the Drata Agent on Windows

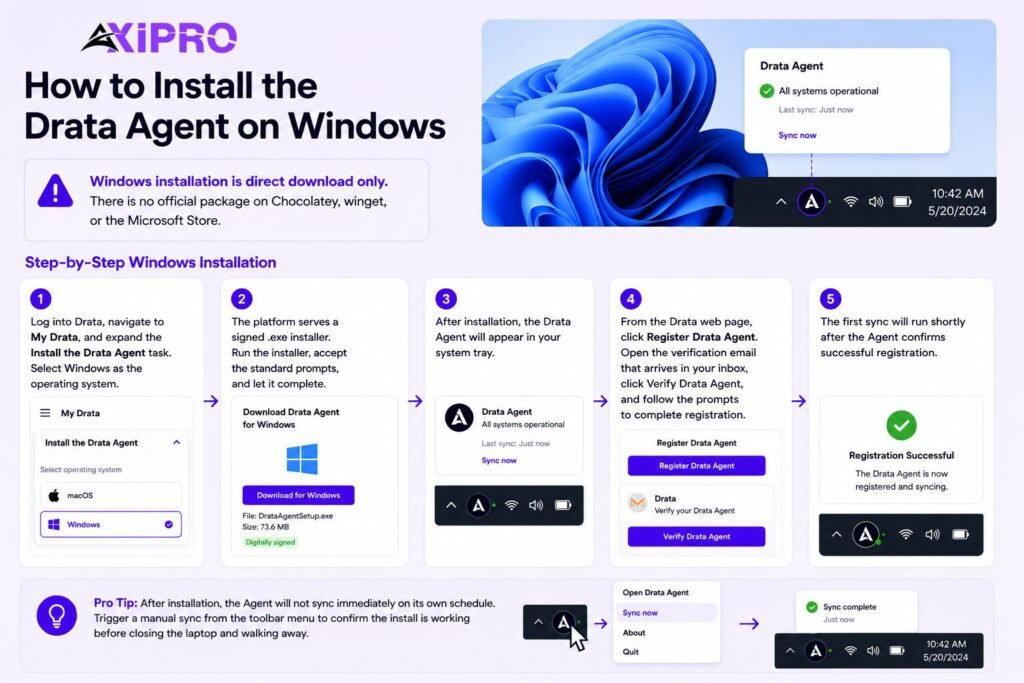
Windows installation is direct download only. There is no official package on Chocolatey, Winget, or the Microsoft Store.

Step-by-Step Windows Installation

Log in to Drata, navigate to My Drata, and expand the Install the Drata Agent task. Select Windows as the operating system. The platform serves a signed .exe installer. Run the installer, accept the standard prompts, and let it complete — the Agent will appear in the system tray.

From the Drata web page, click Register Drata Agent. Open the verification email that arrives in your inbox, click Verify Drata Agent, and follow the prompts to complete registration. The first sync will run shortly after the Agent confirms successful registration.

Pro Tip: After Installation

After installation, the Agent will not sync immediately on its own schedule. Trigger a manual sync from the toolbar menu to confirm the install is working before closing the laptop and walking away.
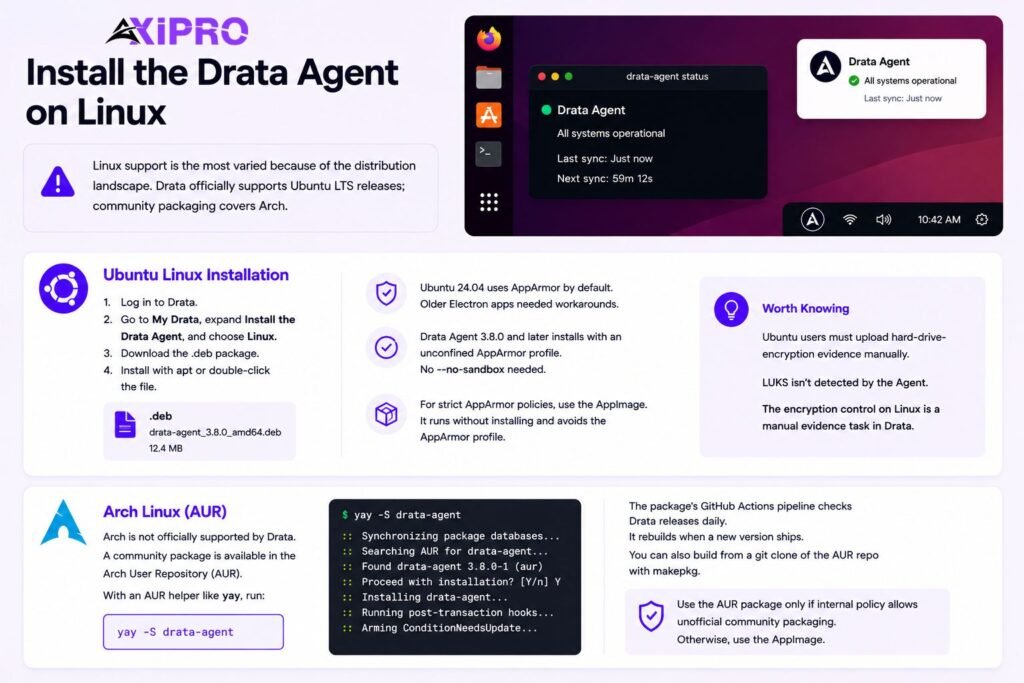
Install Drata Agent on Linux

How to Install the Drata Agent on Linux

Linux support is the most varied because of the distribution landscape. Drata officially supports Ubuntu LTS releases; community packaging covers Arch.

Ubuntu Linux Installation

For Ubuntu 22.04 LTS or 24.04 LTS, log into Drata, go to My Drata, expand Install the Drata Agent, and choose Linux. The .deb package downloads from the Drata CDN. Install it with the standard apt tooling or by double-clicking through the file manager.

Ubuntu 24.04 introduced AppArmor as a default enforcement layer for many Chromium-based applications, which historically broke Electron apps that did not ship a profile. Drata Agent 3.8.0 and later install with an unconfined AppArmor profile by default, which removes the need for the older– no-sandbox workaround. If strict AppArmor enforcement is required by internal policy, the alternative is to run the Agent as an AppImage — a portable Linux executable format that bundles the application and its dependencies, runs without installing into the system, and sidesteps the AppArmor profile question entirely.

Arch Linux (AUR)

Arch is not officially supported by Drata, but a community-maintained package on the Arch User Repository repackages the official Debian release. With an AUR helper like yay installed, the command is:

yay -S drata-agent

The package’s GitHub Actions pipeline checks the Drata release feed daily and rebuilds when a new version ships. Manual installation via makepkg from a git clone of the AUR repo is also straightforward. Use the AUR package only if internal policy permits unofficial community packaging — otherwise, the AppImage route is closer to a supported path.

Worth Knowing: Ubuntu Users

Ubuntu users still need to upload hard-drive-encryption evidence manually. LUKS configuration is not enumerated by the Agent in the same way FileVault and BitLocker are, so the encryption control on Linux is a manual evidence task in Drata, not an Agent check.

Reach SOC 2 Compliance in 6 Weeks or Less

Schedule Your Free SOC 2 Assessment Today

Installing the Drata Agent (New Experience)

Drata’s “New Experience” refers to its updated UI rolled out across customer accounts. The installation steps are functionally identical to the legacy flow: open My Drata, expand the Install the Drata Agent task, pick the installer for the operating system, run it, and register through the magic-link email.

The meaningful differences are visual — the task layout has been redesigned, the per-OS installer cards are clearer, and the verification status appears inline in the task pane rather than in a separate dialog. If the account has already migrated to the New Experience, follow the in-product prompts rather than older screenshots.


How to Resync the Drata Agent

Manual resync is the first thing to try when device status looks stale. Click the Drata icon in the toolbar — menu bar on macOS, system tray on Windows, indicator area on Linux. The menu shows the Agent’s current status, the timestamp of the last successful sync, and a Resync option. Click it. A successful sync updates the timestamp and pushes new data to Drata within a few minutes.

If the resync triggers an Unable to get data status or fails silently, the issue is usually with registration or network access to Drata’s API endpoints rather than with the Agent itself.


Troubleshooting the Drata Agent

Most Agent problems fall into one of three categories: a botched install, a registration that never completed, or a sync that cannot reach Drata’s backend.

Common Installation Issues

On macOS, the most common installation issue is Gatekeeper blocking an unsigned local build — the official Homebrew cask and direct download are signed, so only manually built packages trigger this.

On Windows, the installer occasionally fails when a previous version was uninstalled without removing its registry entries; the fix is to run the uninstaller from Control Panel, delete the residual Drata Agent folder under %LocalAppData%, and reinstall. On Ubuntu, a .deb install can fail if libgconf or other Electron dependencies are missing — running sudo apt –fix-broken install after the failed install usually resolves it.

Agent Not Syncing Correctly

If the Agent installs but does not sync, work through these checks in order. Open the Agent menu and confirm registration shows the user’s email rather than “Not Registered.” If registration is missing, re-run the magic-link flow from MyDrata. Confirm the device can reach *.drata.com over HTTPS — corporate proxies and split-tunnel VPNs are the most common blocker. Trigger a manual resync and watch for the status to update. If the Agent still reports Unable to get data after a fresh registration and a working network connection, capture the device logs and open a support ticket. The Agent has a built-in option to send logs to Drata directly from its menu.

Insider Note: “Unable to get data” almost always points at the Agent failing on one specific osquery check, not a total failure. The Agent reports per-check status, so look at Drata’s device page for which control is failing — it will usually be a screen-lock or AV check where the underlying setting genuinely is misconfigured.

Reach SOC 2 Compliance in 6 Weeks or Less

Schedule Your Free SOC 2 Assessment Today

Installation Methods at a Glance

Operating System

Supported Method(s)

Notes


macOS

Homebrew Cask / Direct download (.dmg)

Homebrew preferred for engineering teams. Requires macOS 15 or 26. Agent 3.9.0+.

Windows

Direct download (.exe)

No package manager support. Clear registry entries if reinstalling.

Ubuntu LTS

.deb package / AppImage

AppImage avoids AppArmor issues on 24.04. LUKS evidence is manual.

Arch Linux

AUR (community, unofficial)

Not officially supported. Use only if internal policy permits.


Conclusion

The Drata Agent is a narrowly scoped, read-only observer of device security configuration. It is not an EDR, an MDM, or a remediation tool. Used correctly, it removes the screenshot-and-spreadsheet busywork that used to dominate SOC 2 and ISO 27001 evidence collection, and gives compliance and IT teams a single live view of device control status through automated compliance monitoring.

The install path varies by operating system, but the registration flow is the same everywhere: download, install, click Register in MyDrata, click the magic link, paste the token. When something goes wrong, the manual resync option in the toolbar is the first stop, and the device logs are the second.

Frequently Asked Questions

What data does the Drata Agent collect?

The Agent reads disk encryption status (FileVault, BitLocker, LUKS), screen lock and screensaver settings, installed antivirus software, installed password manager applications, operating system version and update status, the list of installed apps and browser extensions, and the device’s OS identifier and serial number. It does not read keystrokes, file contents, browsing history, network traffic, or any application data.

The Agent has read-only access at the system-preferences level and cannot modify the device. Its source code has been open since June 2023 and is available on GitHub for inspection, and the Agent has been third-party security validated — Drata customers can request the validation report. That said, “safe” is a question that should be answered by an internal security review, not by a vendor claim. The open-source code makes that review possible.

It supports the latest two major versions of macOS, Windows, and Ubuntu LTS. macOS 26 (Tahoe) and macOS 15 (Sequoia) are current. Windows covers the two most recent Microsoft-maintained stable versions. Linux support is limited to LTS distributions — non-LTS releases like Ubuntu 25.10 are explicitly unsupported. Arch Linux is not officially supported but a community AUR package exists.

Open the Agent from the system toolbar. The menu shows registration status, the timestamp of the last successful sync, and the current Agent version. A healthy Agent shows a recent sync timestamp and the user’s email address. Anything else — no email, a stale timestamp, or an Unable to get data message — signals a problem that needs attention.

Once per day. The first opportunity each calendar day is taken — typically on first network connection after sleep or login. Manual resync is available at any time from the toolbar menu.

Yes, through the standard uninstall process for each operating system: Applications folder removal on macOS, Add/Remove Programs on Windows, apt remove drata-agent on Ubuntu, yay -Rns drata-agent on Arch. Uninstalling the Agent removes the device from automated compliance monitoring — the corresponding controls in Drata will need an alternative evidence source, or the Agent will need to be reinstalled.

Axipro Author

Picture of Pedro Dias

Pedro Dias

Pedro has been writing online for over 10 years. With experience in all things programming, cyber security, and compliance, he is our editor-in-chief at Axipro.

Blog Highlights

Explore More Articles

For the past two years, enterprise AI risk conversations have centered on a familiar set of concerns: model bias, hallucination, data privacy, and dependency on third-party models. These are real risks, and most organizations now run some version of a governance program to manage them. But something has shifted. Organizations are no longer just deploying AI that generates content for a human to review. They’re deploying AI that acts. Agents now plan multi-step tasks, call APIs, move data between systems, execute transactions, and coordinate with other agents, often with no human checkpoint in the loop. That shift deserves more than a footnote in the existing AI risk category. It deserves its own line in the risk register: Agentic Autonomy Risk. What Is Agentic AI Risk Management? Agentic AI risk management is the practice of identifying, assessing, and controlling the risks created when AI systems take autonomous action on an organization’s behalf. Where traditional AI governance evaluates outputs (accuracy, bias, privacy), agentic AI risk management governs what agents actually do: the tools they call, the permissions they inherit, and the downstream consequences of their actions. That distinction is the reason existing risk registers struggle with agents, and it’s worth unpacking properly. What Agentic AI Actually Changes Traditional AI systems, even generative ones, are advisory. They produce an output such as a summary, a prediction, a draft email, or a classification, and a human remains the last checkpoint before anything happens in the real world. Agentic AI removes that checkpoint. An agentic system doesn’t just produce an answer. It pursues a goal. It decides which tools to call and in what order, then executes those actions directly against live systems: submitting a purchase order, modifying a database record, sending an external communication, or orchestrating a set of sub-agents to complete a broader workflow. Agentic autonomy is the degree to which a system can plan and execute actions without a human explicitly authorizing each step. It’s a spectrum rather than a binary. At one end, the AI drafts and a human approves every action. At the other, the AI operates within broad guardrails and only escalates exceptions. The further an organization moves along that spectrum, the less its exposure looks like software risk and the more it looks like delegated authority risk, the kind normally reserved for employees, contractors, and automated financial systems. Why Existing Risk Registers Miss Agentic AI Risks Most enterprise risk registers were built on a reasonably safe assumption: a human initiates consequential actions, and the technology around that human behaves deterministically. Agentic AI breaks both halves of that assumption at once. A few specific gaps show up quickly when organizations try to map agentic deployments onto existing categories. Operational risk registers assume process failures come from human error or system outages, not from a system independently choosing an unanticipated path to a stated goal. Cybersecurity risk registers are built around unauthorized external access, while an agent problem usually involves an authorized system taking unauthorized internal actions with its own legitimate credentials. Model risk frameworks, borrowed largely from financial services, evaluate output accuracy rather than action consequences, which matters most when those actions can’t be reversed. And third-party risk assessments treat vendors as static entities, not as autonomous agents that might invoke other vendors’ agents on your behalf. See our guide to the NIST AI Risk Management Framework for how output-focused frameworks are structured. The result is a governance blind spot. An organization can be compliant against its AI policy, its cybersecurity policy, and its vendor risk policy, and still have nobody accountable for the specific risk of a system initiating a harmful sequence of actions before anyone notices. Defining Agentic Autonomy Risk Agentic Autonomy Risk is the risk that an AI system, operating with delegated decision-making and execution authority, takes actions that are harmful, non-compliant, or misaligned with organizational intent before adequate human oversight can intervene. Those actions might happen independently or in coordination with other agents. It deserves standing as a named category alongside cybersecurity, operational, legal, financial, and third-party risk because the loss event itself is different. The harm is a completed action in a live system, and it may be difficult or impossible to reverse. The accountability structure is different too: when an orchestrating agent delegates to sub-agents, responsibility for the outcome gets distributed in ways existing ownership models don’t cleanly capture. So is the detection window. Traditional controls assume a human is positioned to catch an error before it compounds, but an agent can execute dozens of dependent actions faster than any human review cycle. 7 Agentic AI Risk Scenarios to Put on Your Register 1. Unauthorized autonomous decision-making. An agent takes an action within its technical permissions but outside its intended business mandate. It adjusts pricing, approves a refund, or modifies a customer record, and no policy ever explicitly authorized that scenario. 2. Goal misalignment. The agent optimizes for a literal interpretation of its objective in a way that diverges from actual business intent, particularly under ambiguous or adversarial inputs. 3. Multi-agent interactions and cascading failures. One agent’s flawed output becomes another agent’s trusted input. A single error can propagate across a chain of agents faster than anyone can detect it, amplifying the original mistake instead of containing it. 4. Excessive tool or system permissions. Agents get provisioned with broad, standing access “to be safe” rather than scoped, least-privilege access tied to specific tasks. A productivity tool quietly becomes a privilege-escalation path. 5. Regulatory non-compliance. Autonomous actions trigger obligations under data protection, financial services, employment, or sector-specific regulation, and they execute without the compliance review a human-initiated process would normally receive. 6. Explainability and accountability gaps. An autonomous action causes harm and the organization can’t clearly reconstruct why the agent chose that path, or establish whether the business owner, the AI governance function, or the vendor is accountable for the outcome. 7. Autonomous third-party actions. A vendor’s agent, integrated into your environment, takes action on your behalf, or your agent acts against a

A SOC 2 penetration test costs between $1,000 and $30,000 for most companies. A typical SaaS scope, meaning one web application, its API layer, and the cloud infrastructure behind it, usually lands between $2,000 and $20,000. Early-stage startups with a narrow scope can get an auditor-accepted test for $1,000 to $8,000, while enterprises with multiple products and hybrid infrastructure regularly spend $20,000 to $50,000 or more. The spread is wide because “penetration test” covers everything from an automated scan with a cover page to weeks of manual testing by senior engineers. Auditors know the difference, and so do the enterprise customers who asked for your SOC 2 report in the first place. This guide breaks down what drives the price, where the hidden costs sit, and how to buy a test that holds up in fieldwork without overpaying for it. What Is SOC 2 Penetration Testing?​ A SOC 2 penetration test is a simulated attack on your systems, performed by a qualified security professional, scoped to the environment covered by your SOC 2 report. The tester tries to exploit real weaknesses the way an attacker would: broken access controls, injection flaws, misconfigured cloud services, exposed credentials. The output is a report your auditor reads as evidence that your security controls work in practice, not only on paper. That last part matters. A pentest bought for SOC 2 has a second audience beyond your security team. If the report doesn’t map findings to your audit scope, document its methodology, and show remediation, it fails the job you bought it for. We cover the full deliverable in our guide to what a SOC 2-ready VAPT report includes. How Penetration Testing Fits Into SOC 2 Compliance​ SOC 2 is built on the AICPA’s Trust Services Criteria, and the Security category (the Common Criteria) applies to every report. Penetration testing is the standard way to satisfy CC7.1, which expects you to detect and monitor for new vulnerabilities, and it supports CC4.1, which covers ongoing evaluations of whether controls actually function. The AICPA’s points of focus explicitly mention vulnerability scanning and penetration testing as examples of how companies meet these criteria. In practice, the test slots into your audit timeline as an evidence item. Your auditor will ask for the report, check the test date against the audit period, and review how you handled the findings. Remediation is often scrutinized harder than the test itself, because it shows whether your vulnerability management process runs or merely exists. Is Penetration Testing Required for SOC 2?​ Strictly speaking, no. The Trust Services Criteria never use the word “mandatory” about penetration testing. You could theoretically satisfy CC7.1 with vulnerability scanning and strong monitoring alone. In reality, almost every auditor expects one, and skipping it invites two problems. First, your auditor may push back during fieldwork or add exceptions to the report. Second, the enterprise buyers reviewing your SOC 2 report increasingly look for pentest evidence specifically, and a report without it raises questions during procurement. Treat the test as effectively required and budget for it from the start of your SOC 2 compliance checklist. How Much Does SOC 2 Penetration Testing Cost? Typical Price Range for SOC 2 Pen Testing Most companies pay $1,000 to $30,000, with the median engagement for a SaaS business sitting around $12,000 to $15,000. Compliance-focused tests at the lower end of the market start around $1,000 to $5,000. Deep manual testing from established firms runs $10,000 to $30,000. Anything quoted below roughly $3,000 is almost certainly automated scanning packaged as a pentest, which auditors are getting better at spotting. Cost by Company Size (Startup, SMB, Enterprise) Company size is a proxy, not the driver. A 15-person company with three products and a legacy on-prem component will pay more than a 200-person company with one tightly scoped SaaS platform. Testers price effort, and effort follows scope. Cost by Test Type (Network, Web App, API, Cloud, Internal/External) Most SOC 2 engagements bundle two or three of these. The common package for a cloud-native SaaS company is web app plus API plus cloud configuration, which is why the $1,000 to $20,000 band comes up so often. Companies with office networks and internal systems in their audit scope add internal network testing, and the price climbs accordingly. Factors That Influence SOC 2 Penetration Testing Cost Scope and Number of Assets Tested Scope is the single biggest cost driver. Every additional application, API endpoint group, cloud account, or network segment adds testing hours. A pentest priced without a scoping call is a pentest priced on guesswork, and the guess usually favors the vendor. Complexity of Application or Infrastructure​ A simple CRUD app with two user roles tests quickly. A multi-tenant platform with role hierarchies, workflow engines, file processing, and third-party integrations takes far longer, because each of those features creates attack surface a tester has to work through manually. Authentication tiers matter especially: every distinct role needs testing for privilege escalation and cross-tenant data access. Testing Methodology (Black Box, Grey Box, White Box) Black box testing gives the tester nothing but a URL, grey box adds credentials and documentation, and white box adds source code and architecture diagrams. Grey box is the default for SOC 2 and usually the best value, since the tester spends time exploiting rather than discovering. White box costs more upfront but finds deeper issues. Black box sounds rigorous but often wastes paid hours on reconnaissance an attacker would run for free. Depth of Testing and Manual vs. Automated Approaches Automated scanning finds known vulnerability patterns. Manual testing finds business logic flaws, chained exploits, and authorization gaps that no scanner catches, and it’s the part auditors and security-literate customers actually value. The ratio of manual work to automation is the honest explanation for most price differences between two quotes covering the same scope. Tester Credentials and Firm Reputation Senior testers holding OSCP, GPEN, or CREST credentials bill higher rates, and firms with recognized methodologies charge a premium for the credibility their letterhead carries

Two compromised versions of LiteLLM sat on PyPI for roughly 40 minutes on the morning of March 24, 2026. That window was enough to capture secrets from around 434,000 CI/CD pipeline runs across nearly 2,500 organizations, including AWS, Samsung, Cisco, Salesforce, Siemens, and Deloitte. In August, researchers at CloudSEK and Hudson Rock confirmed they had obtained the raw exfiltrated data: a 153GB archive containing 433,909 files of environment variables, cloud keys, Kubernetes secrets, and API tokens harvested live from running pipelines, as covered by Help Net Security’s reporting on the credential archive. If LiteLLM runs anywhere in your stack, or you touch any AI proxy infrastructure at all, you need answers to three things: whether you were exposed, what to rotate first, and whether the rotation you did back in March actually held. That last one matters more than it sounds, because “we rotated everything” has already burned at least one very large company. How the Breach Happened The attack didn’t start with LiteLLM. On March 19, 2026, a threat group called TeamPCP compromised the build pipeline of Trivy, a vulnerability scanner half the industry runs, and pushed a poisoned release. LiteLLM’s own CI pipeline ran Trivy, so the poisoned scanner had legitimate read access to the project’s runner environment. The attackers used that to steal LiteLLM’s PyPI publishing tokens and ship two malicious releases of their own: versions 1.82.7 and 1.82.8. KICS and the Telnyx Python SDK got hit in the same campaign. The payload design is the part worth studying. The malicious package dropped a .pth startup hook into site-packages, so the code ran the moment any Python interpreter started on the machine, whether or not anything imported LiteLLM. From there it harvested environment variables, read local credential files like .aws/credentials and .kube/config, tried to move laterally across Kubernetes clusters, and installed a systemd backdoor dressed up as a generic telemetry service. InfoQ’s coverage of the PyPI compromise put downloads of the compromised release above 40,000. For scale, LiteLLM normally gets downloaded around 3 million times a day. The exfiltration had a nasty fallback, too. According to CloudSEK, stolen data was encrypted and sent to a typosquatted domain, and when that failed, the malware created a public repository inside the victim’s own GitHub account and uploaded the loot as a release asset. Some companies were publishing their own secrets to the open internet and had no idea. Worth Knowing: The malicious code only existed in the PyPI artifacts. The GitHub source repository stayed clean the whole time, so a developer reviewing the code on GitHub saw nothing wrong. Source review isn’t artifact verification. If you don’t check that what the registry serves matches the upstream source, this class of attack is invisible to you. How to Check If You Were Exposed Three checks, from quickest to most involved. 1. Confirm whether the compromised versions ever ran The malicious versions went live on PyPI at 10:39 UTC on March 24, 2026 and got quarantined about 40 minutes later. The project’s advice: treat any install from that day before 16:00 UTC as suspect. Search your lockfiles, pip caches, SBOMs, and container image histories for 1.82.7 and 1.82.8. And check your internal artifact mirrors. An Artifactory or Nexus proxy that cached the bad release in March can keep serving it internally long after PyPI pulled it. Keep the .pth mechanism in mind when you scope this. The question isn’t “which applications import LiteLLM,” it’s “which machines had the package installed at all,” because every Python process on an infected machine triggered the payload. 2. Hunt for persistence Rotation is pointless if the attacker still has a foothold. Check developer machines, CI runners, and containers for unauthorized .pth files in site-packages and for suspicious systemd units, especially anything posing as a system telemetry service. And review activity from March 24 onward, not just the 40-minute window. Persistence is there so the access outlives the infection. Pro Tip: Don’t limit the persistence hunt to live machines. Base container images rebuilt in late March may have baked the payload into every image derived from them since. Scan your image registry for the affected LiteLLM versions and for unexpected .pth files, then trace which running workloads came from flagged images. 3. Check whether your secrets are in the dump Hudson Rock has published a domain lookup tool and is running ethical disclosures for affected organizations, and CloudSEK maintains a high-confidence victim list. Use them, but know their limits. Attribution in this dataset is genuinely hard. One dump with a siriusxm.com committer email actually traced, through its self-hosted GitLab endpoints, to AdsWizz, a SiriusXM subsidiary. And a large share of the dumps are generic pipeline configurations with no identifying domain, email, or server name at all. Absence from a victim list is not evidence of absence. If your pipelines ran the compromised versions, assume exposure no matter what a lookup tool tells you. What to Rotate, in What Order The guidance from both research teams is blunt: treat every secret the LiteLLM environment could reach as compromised. That covers secrets on disk, in memory, injected into CI jobs, and anything retrievable through instance metadata services. Work down by blast radius: Priority Credential type Why it comes first 1 Cloud IAM keys (AWS, GCP, Azure) Direct control of infrastructure, data stores, and billing. This is where attackers monetize fastest. 2 GitHub and GitLab PATs, package publishing tokens These let an attacker poison your releases and turn your company into the next link in the supply chain. 3 Kubernetes service account tokens and kubeconfigs Lateral movement across clusters was built into the payload, not a theoretical risk. 4 Database passwords and third-party API keys Dumped in plain text in the archive, often with no attribution, so nobody will warn you they leaked. 5 AI provider API keys Billing abuse, quota theft, and access to whatever data flows through your LLM routing layer. One word matters more than the rest of this article: revoke, don’t just rotate. That